Debug Dashboard
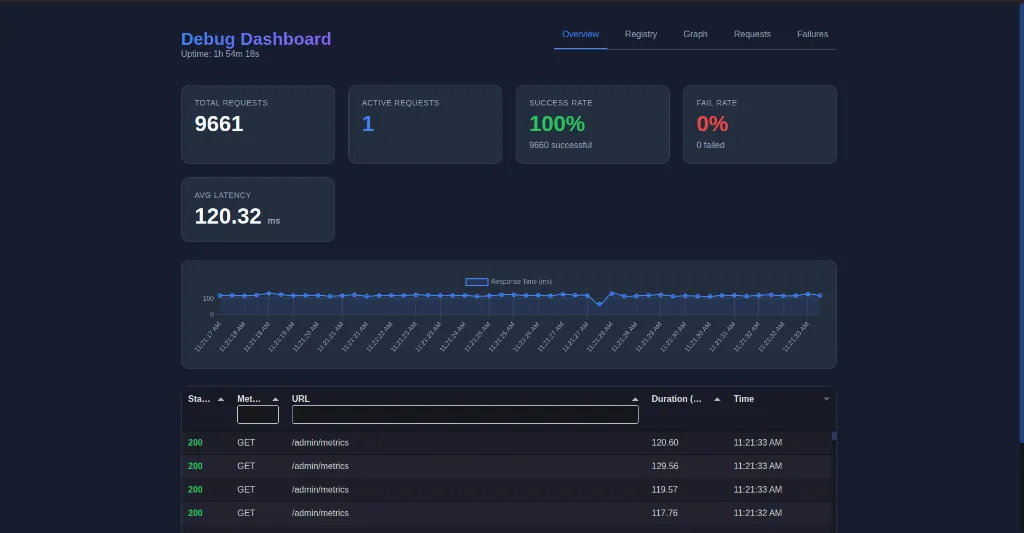
The DebugDashboard provides a visual interface to inspect your running application. It allows you to:
- View real-time metrics (requests/sec, errors, latency).
- Visualize the middleware graph and request flow.
- Inspect the component registry (controllers, routes).
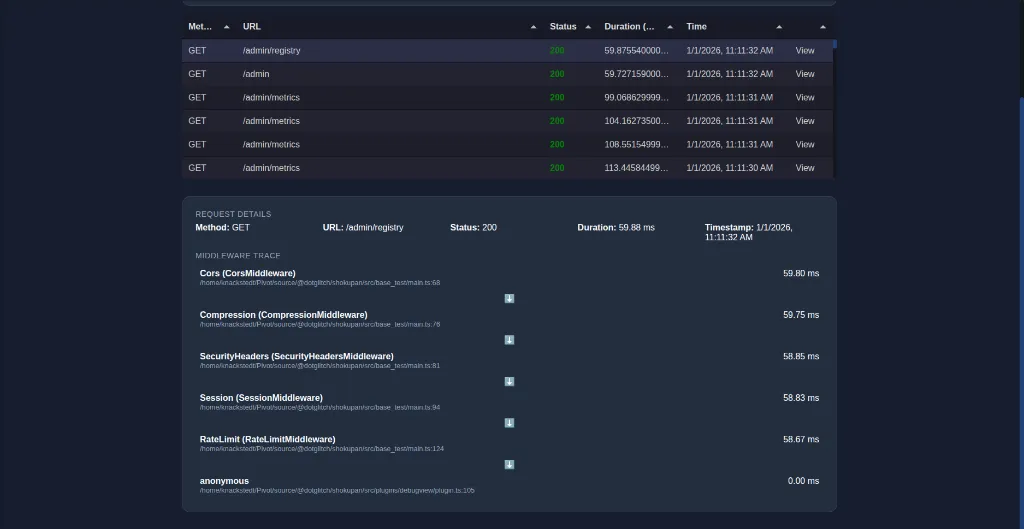
- View middleware execution logs if
enableMiddlewareTrackingis on. - Inspect and replay failed requests captured by
FailedRequestRecorder.
Installation
Section titled “Installation”import { DebugDashboard } from 'shokupan';
// Mount the dashboard at a path of your choiceapp.mount('/debug', new DebugDashboard({ retentionMs: 7200000 // Keep logs for 2 hours}));Configuration
Section titled “Configuration”| Option | Type | Description |
|---|---|---|
retentionMs | number | How long to keep in-memory metrics and logs (ms). |
getRequestHeaders | () => Record<string, string> | Hook to provide custom headers (e.g. auth tokens) when replaying requests from the dashboard. |
Features
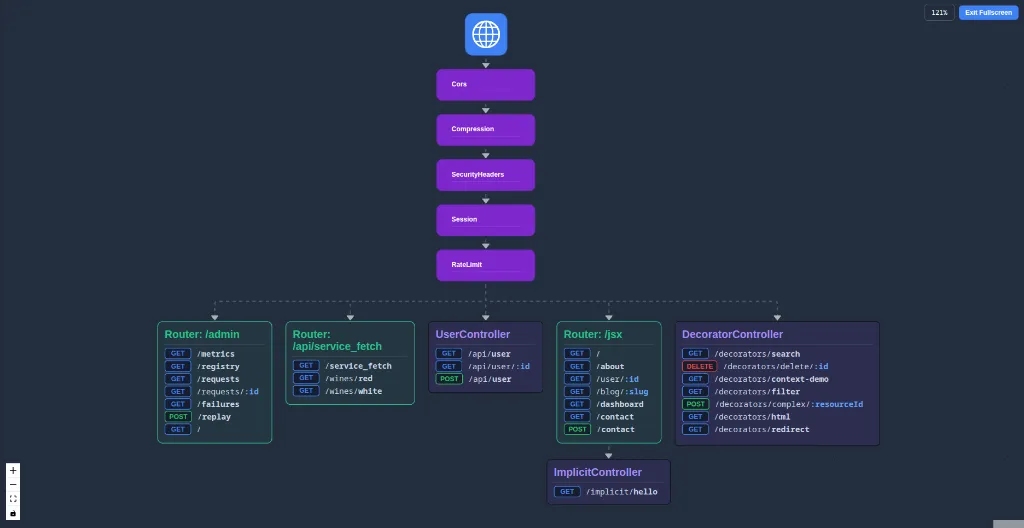
Section titled “Features”Middleware Graph
Section titled “Middleware Graph”Visualizes the structure of your application, showing how routers, controllers, and middleware are connected.
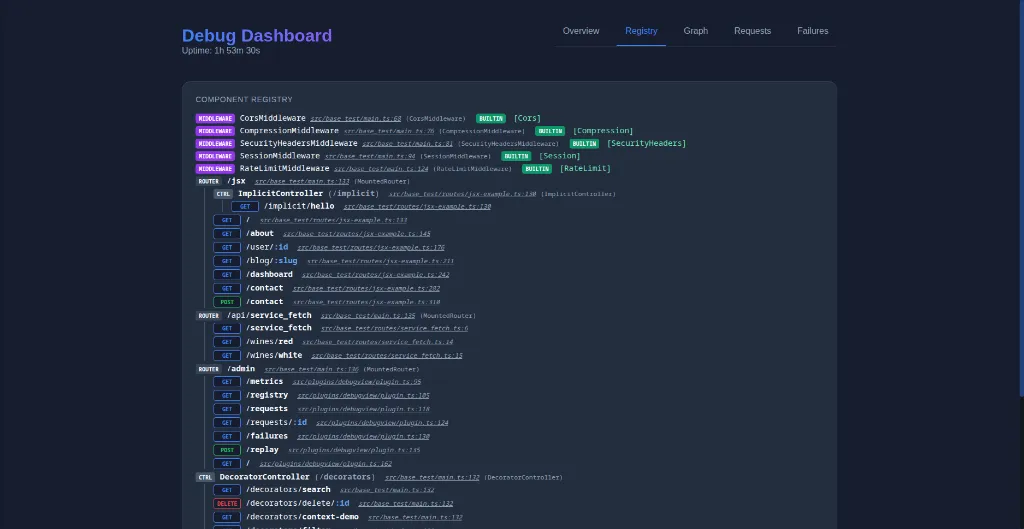
Component Registry
Section titled “Component Registry”Inspect all registered routes and controllers in a flat or hierarchical view.
Requests View
Section titled “Requests View”Analyze incoming requests, their duration, and the time spent in each middleware.
Failed Requests
Section titled “Failed Requests”Lists requests that resulted in errors. You can click on a failure to see details and replay it.
Playback
Section titled “Playback”Replaying a request sends the identical request payload to the server again, which is useful for debugging idempotent operations or testing fixes.